Lesson 5: DC Sweep
This walk-through will show how to set up and run a DC Sweep simulation in OrCAD PSpice Designer. A DC Sweep increments the desired value over a specified range and reports the results measured from the designated point in the circuit.
After you complete this topic, you will be able to:
- Add voltage probes to the circuit
- Configure a DC sweep simulation
- Run the simulation and view plotted results
To follow along, continue with the design from the previous topic or use the provided materials.
If materials were not downloaded at the beginning of the walk-through, files for this lesson can be accessed through the materials tab above.
 Open in New Window
Configuring a DC Sweep Simulation
Step 1: Select PSpice > New Simulation Profile from the menu.
Step 2: Name the simulation profile DC_Sweep. Click Create.
Step 3: Select DC Sweep from the Analysis Type dropdown.
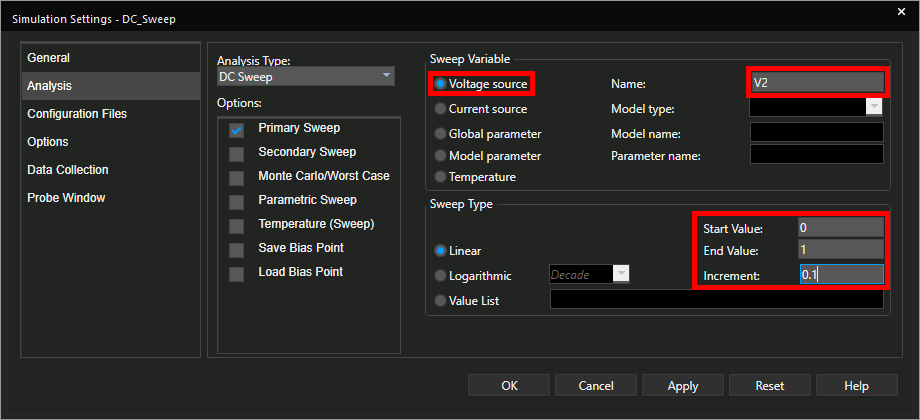
Step 4: Select Voltage Source for the Sweep Variable. Enter V2 for the name.
Step 5: Enter 0 for the Start Value, 1 for the End Value, and 0.1 for the Increment.
Step 6: Click OK to save the simulation settings.
Placing Probes
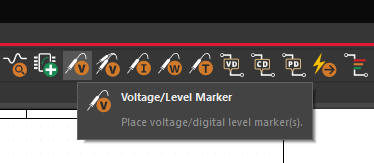
Step 7: Select the Voltage Probe button from the toolbar or PSpice > Markers > Voltage Level from the menu.
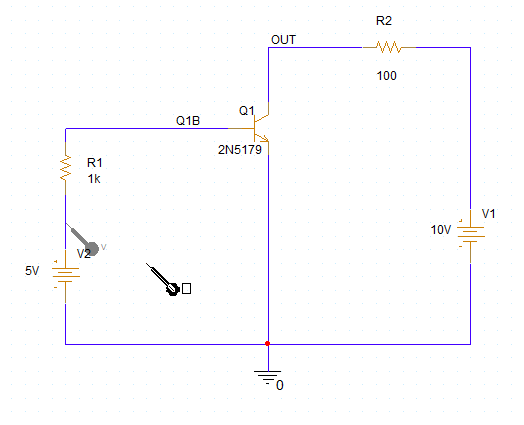
Step 8: Click to place a probe at the node between V2 and R1 to show the swept voltage. Right-click and select End Mode.
Note: Voltage probes can be placed on any node. When placing a current probe, the probe must be placed on a component pin. When placing a power probe, the probe must be placed on a component.
Running the Simulation
Step 9: Select PSpice > Run from the menu.
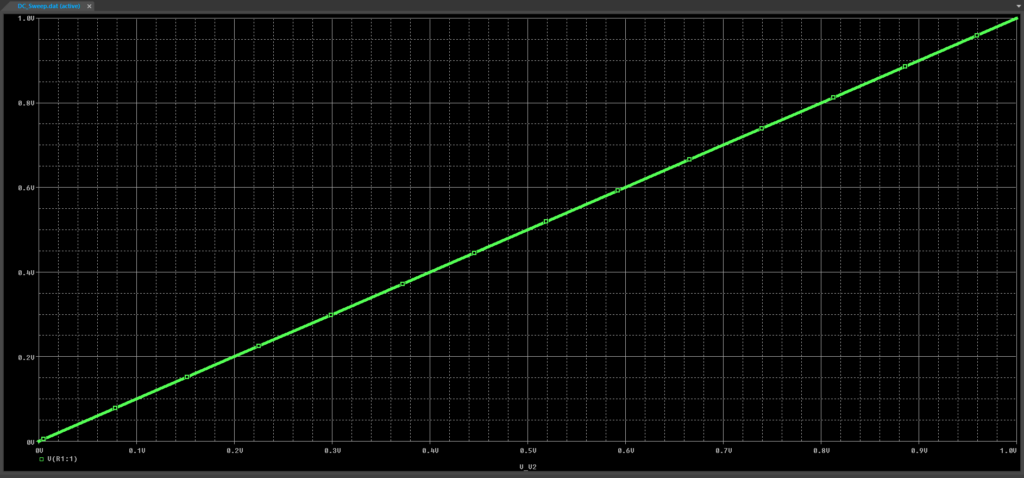
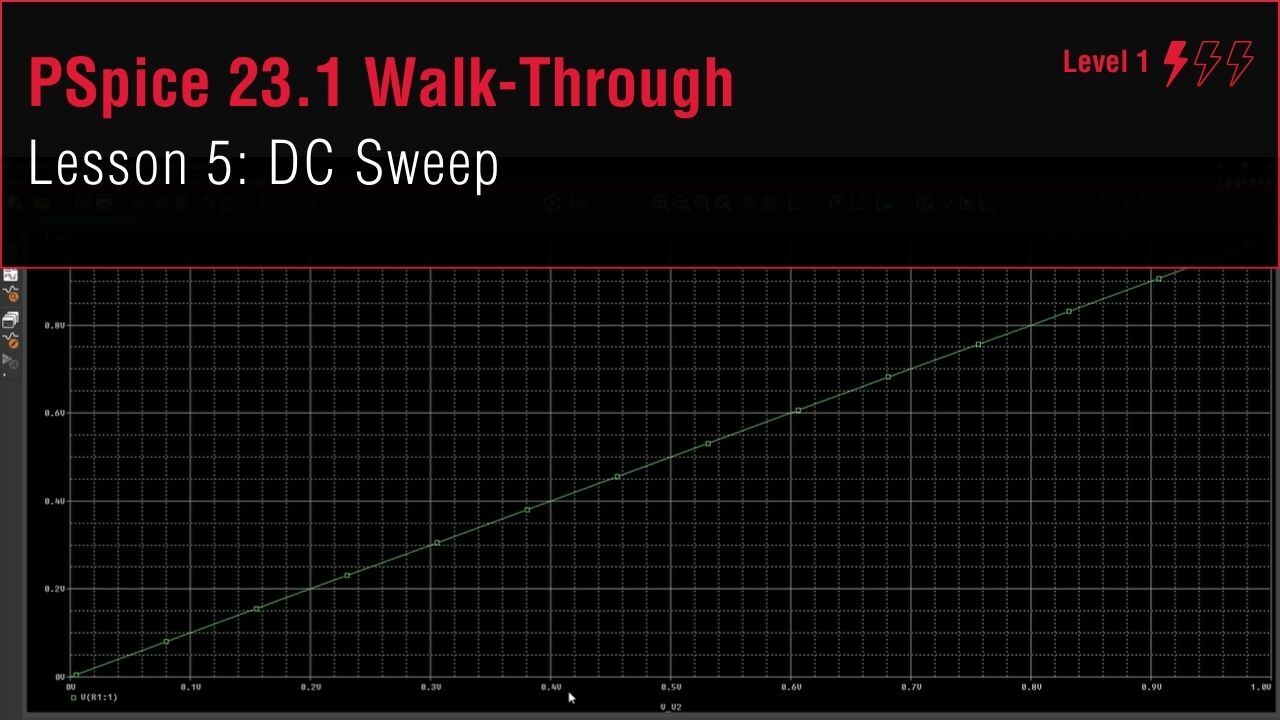
Step 10: View the simulation results. The voltage is swept from 0-1V, creating a linear relationship between X and Y.
Note: By adding a probe on the schematic canvas, the corresponding trace is automatically added in the plot window.
Step 11: View the schematic canvas. The probe is highlighted the same color as the trace in the plot window for easy identification.
Note: Leave the plot window open for the next walk-through topic.