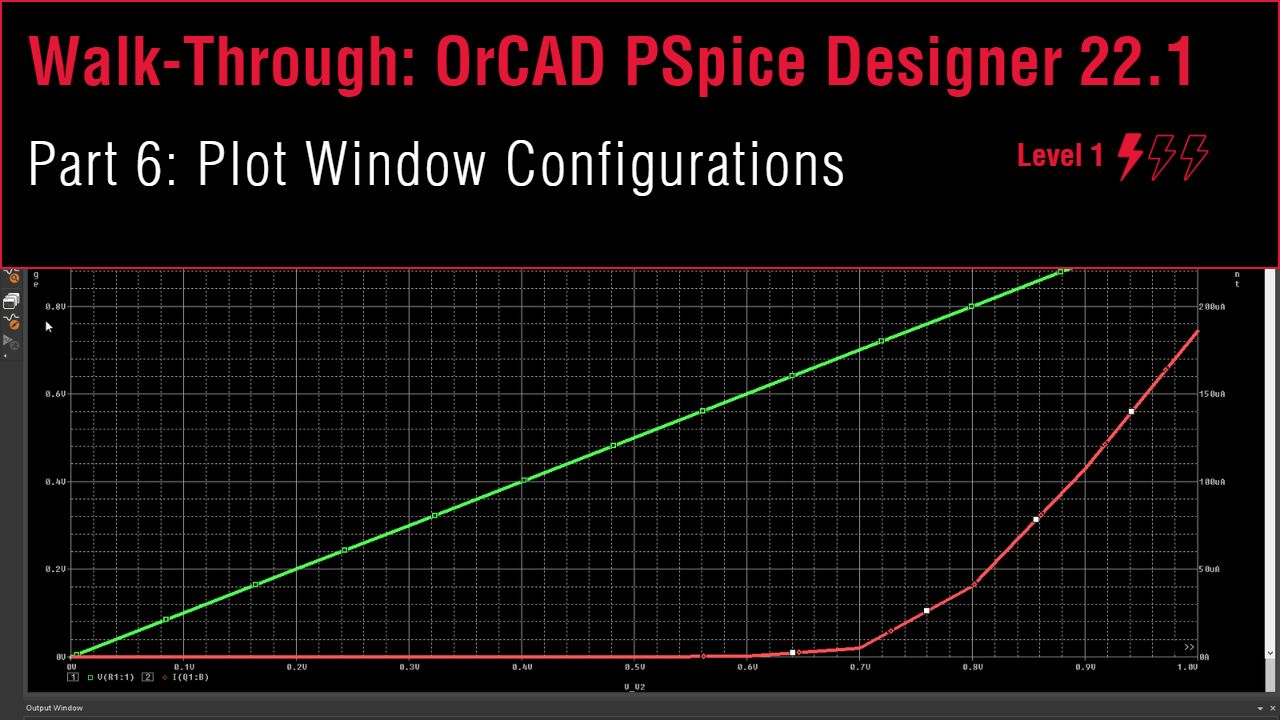
Lesson 6: Plot Window Configurations
This walk-through will show advanced features to configure the plot window in OrCAD PSpice Designer 22.1. After you complete this topic, you will be able to:
- Add traces directly to the result window
- Add a secondary Y axis
- Modify trace properties
To follow along, continue with the design from the previous topic or use the provided materials.
If materials were not downloaded at the beginning of the walk-through, files for this lesson can be accessed through the materials tab above.
 Open in New Window
Adding a Y Axis
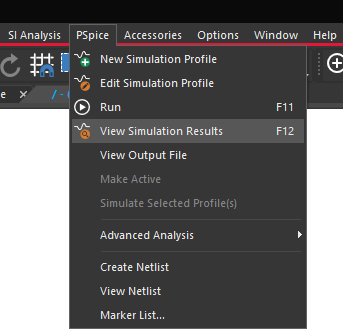
Note: If the simulation results from the last walk-through were closed, select PSpice > View Simulation Results from the menu to view the results without having to re-run the simulation.
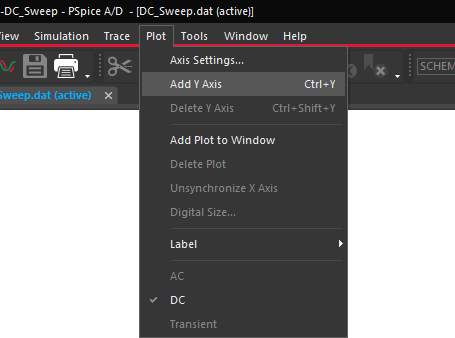
Step 1: In the Simulation Results window, select Plot > Add Y Axis from the menu.
Note: This will add an additional Y axis to the side of the plot.
Step 2: With the new axis selected, select Trace > Add Trace from the menu.
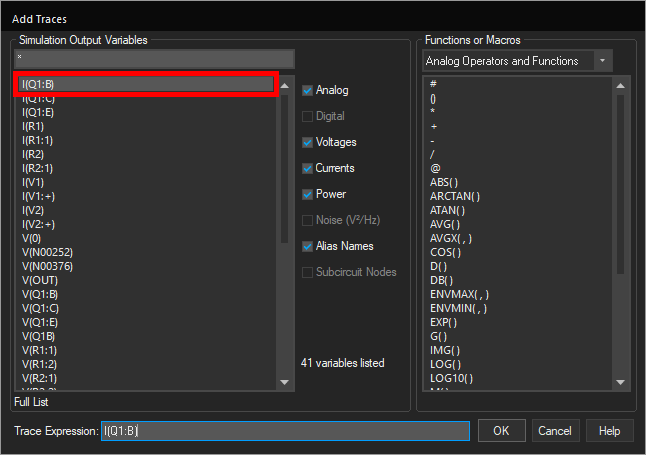
Step 3: The Add Traces window opens. Select I(Q1:B) from the Simulation Output Variables list.
Step 4: Click OK to add the trace to the new axis.
Configuring Axis Settings
Step 5: Select Plot > Axis Settings from the menu.
Step 6: The Axis Settings window opens. Select the Y Axis tab.
Step 7: Select 2 from the Y Axis Number dropdown.
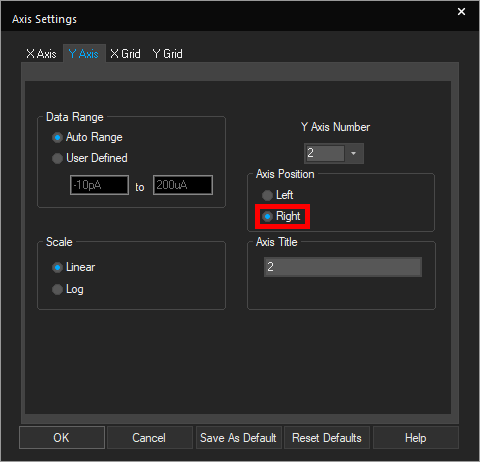
Step 8: Set the Axis Position to Right.
Note: The axis range can also be configured for better visibility. To adjust the axis range, select User Defined under Data Range and set the desired start and end values for the axis.
Step 9: Enter Current for the Axis Title.
Step 10: Select 1 from the Y Axis Number dropdown.
Step 11: Enter Voltage for the Axis Title.
Step 12: Click OK to save the settings and close the window.
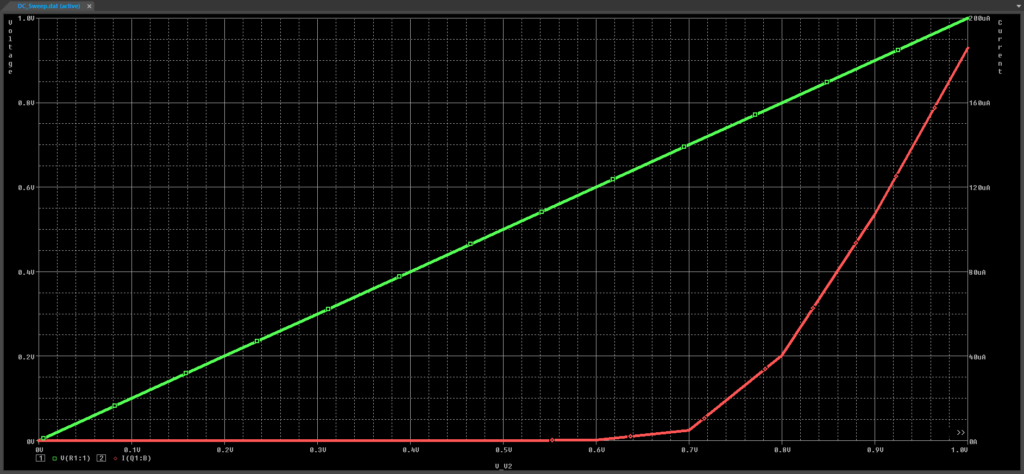
Note: Configuring both traces and axes on a single plot allows for easier analysis of simulation results. The plot shows the linear voltage trace and the base current of Q1 as a result. Current begins flowing around 0.65V.
Modifying Trace Properties
Step 13: Right-click the voltage trace and select Trace Property.
Note: Here you can modify the following trace properties:
- Color
- Pattern
- Width
- Symbol
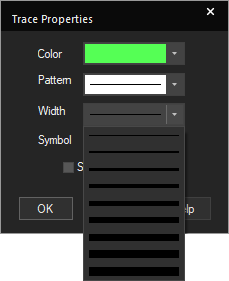
Step 14: Select a thicker trace width from the Width dropdown. Click OK.
Note: This improves visibility of the traces in the plot window and during export of the simulation results.
Step 15: Right-click the current trace and select Trace Property.
Step 16: Select a thicker trace width from the Width dropdown. Click OK.