SPICE simulation is vital during the PCB design to guarantee proper circuit behavior and optimize functionality; however, simulation results are worthless if they cannot be analyzed and communicated efficiently. With PSpice you can quickly and easily configure plot windows to show all of the required data in a clear and easy-to-understand format.
This quick how-to will provide step-by-step instructions on how to configure plot windows in PSpice.
To follow along, download the provided files above the table of contents.
How-To Video
 Open in New Window
Running a Simulation
Note: Before any plot windows are visible, a simulation must be run.
Step 1: Open the provided design in OrCAD PSpice Designer.
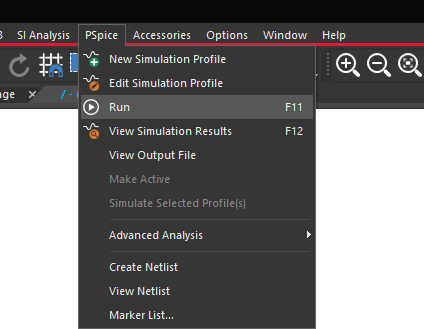
Step 2: Select PSpice > Run from the menu.
Note: If the Simulation Manager Product Choices window opens, select the appropriate license and click OK.
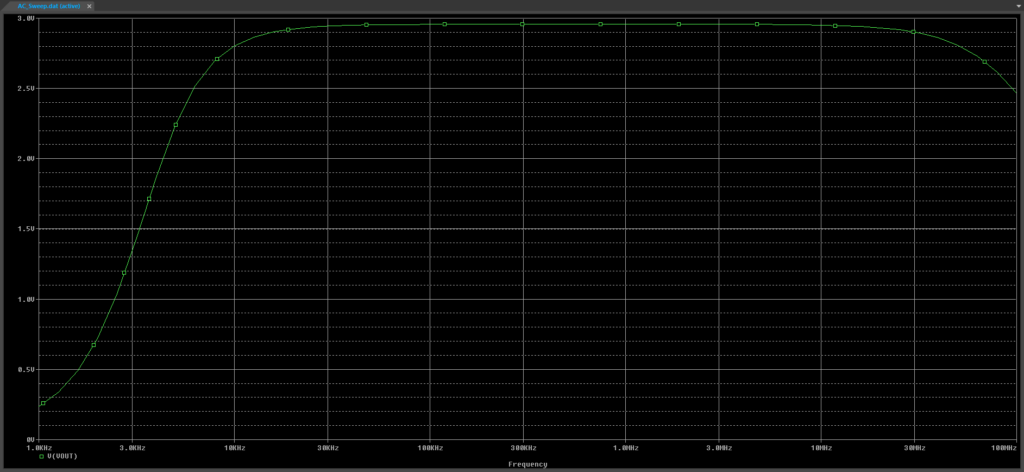
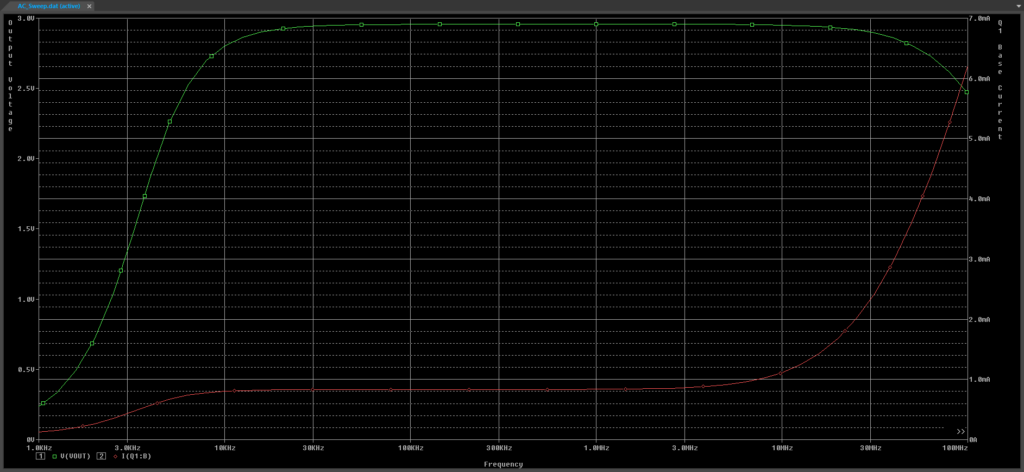
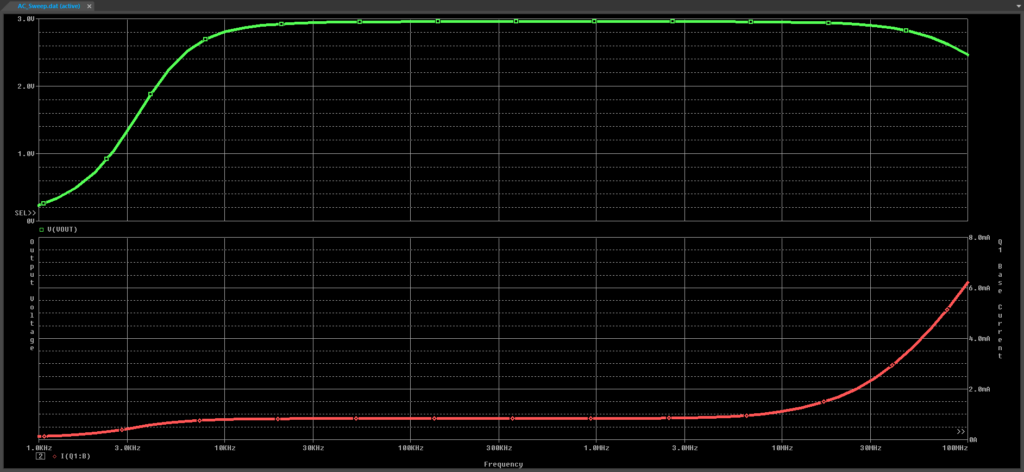
Step 3: View the results. The PSpice A/D window opens with V(VOUT) displayed since a probe was placed on the V(VOUT) node in the schematic.
Adding a Y Axis
Step 4: Select Plot > Add Y Axis from the menu. This will add an additional Y axis to the side of the plot.
Step 5: With the new axis selected, select Trace > Add Trace from the menu.
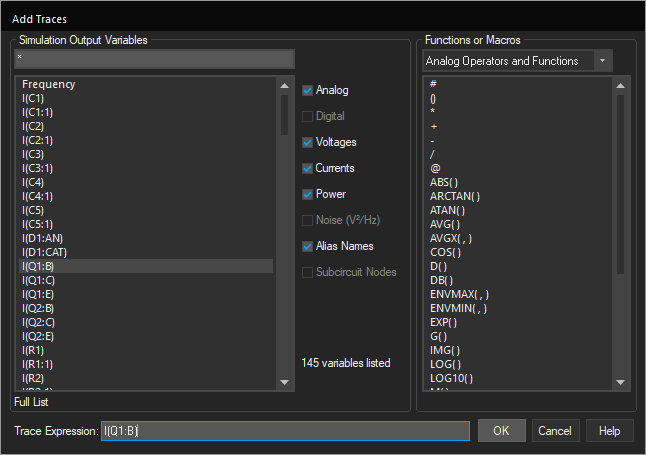
Step 6: The Add Traces window opens. Select I(Q1:B) from the Simulation Output Variables list.
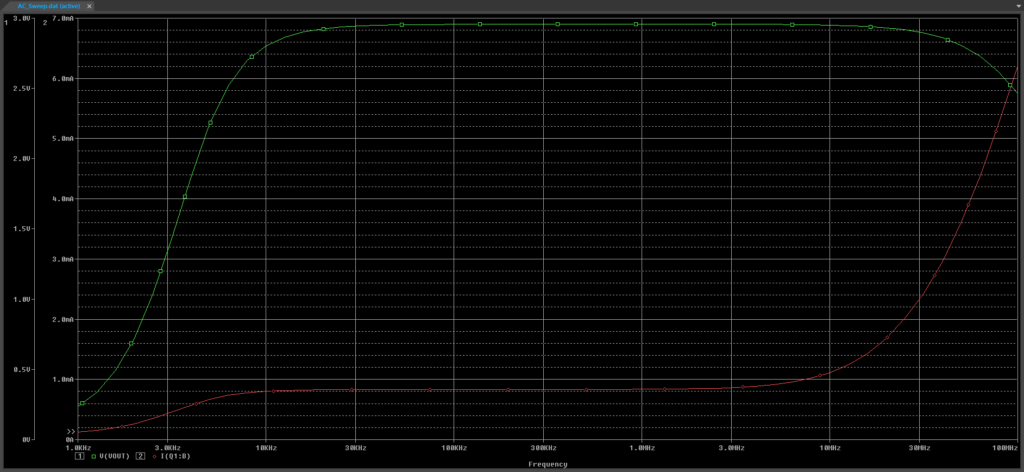
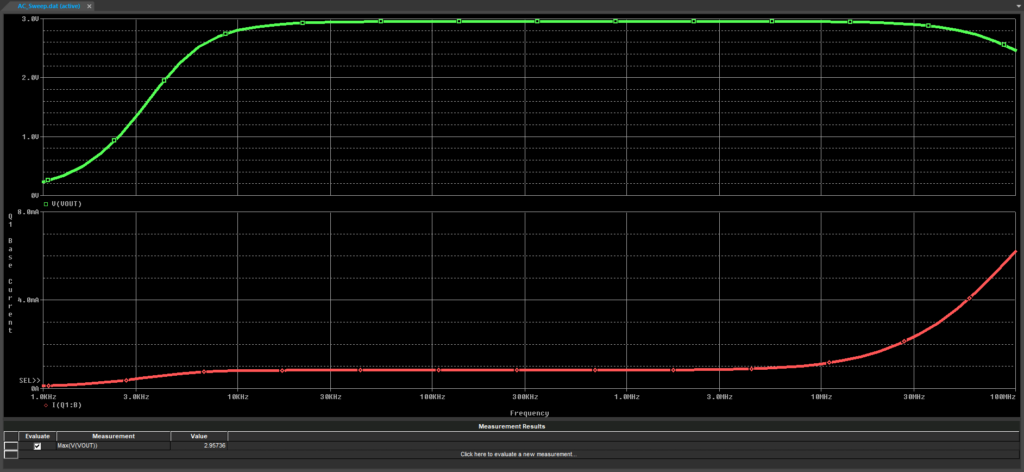
Step 7: Click OK to add the trace to the new axis. View the new plot. The current remains relatively constant between 10kHz and 3MHz, after which point it rises exponentially.
Configuring Axis Settings
Step 8: Select Plot > Axis Settings from the menu.
Step 9: The Axis Settings window opens. Select the Y Axis tab.
Step 10: Select 2 from the Y Axis Number dropdown.
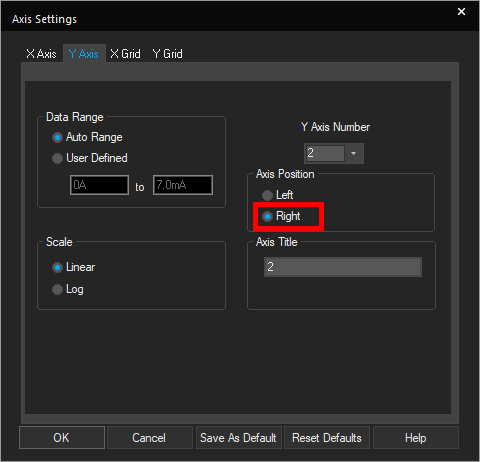
Step 11: Set the Axis Position to Right.
Note: The axis range can also be configured for better visibility. To adjust the axis range, select User Defined under Data Range and set the desired start and end values for the axis.
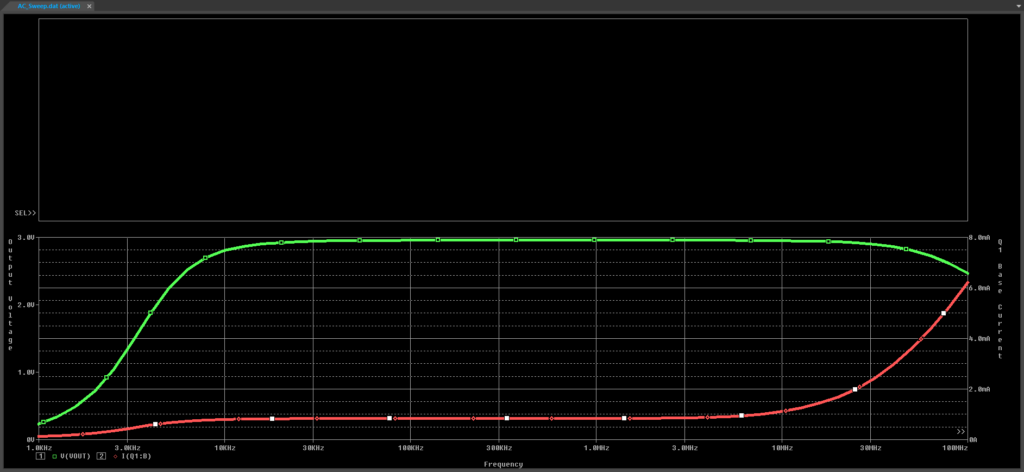
Step 12: Enter Q1 Base Current for the Axis Title.
Step 13: Select 1 from the Y Axis Number dropdown.
Step 14: Enter Output Voltage for the Axis Title.
Step 15: Click OK to save the settings and close the window.
Modifying Trace Properties
Step 16: Right-click the voltage trace and select Trace Property. Here you can modify the following trace properties:
- Color
- Pattern
- Width
- Symbol
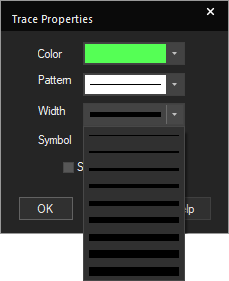
Step 17: Select a thicker trace width from the Width dropdown. Click OK.
Note: This improves visibility of the traces in the plot window and during export of the simulation results.
Step 18: Right-click the current trace and select Trace Property.
Step 19: Select a thicker trace width from the Width dropdown. Click OK.
Configure Plot Windows for a Secondary Plot
Step 20: Select Plot > Add Plot to Window from the menu. A new plot is added above the populated plot.
Step 21: Select the legend icon for V(VOUT) and press CTRL-X to cut.
Step 22: With the new plot selected, press CTRL-V to paste the trace.
Step 23: Right-click the Output Voltage Y-axis in the original plot and select Delete Y Axis. Each trace is now within its own plot, with its own Y-axis scale.
Adding Measurements
Note: Measurements can be added for automatic calculations and numerical analysis of a simulation.

Step 24: Select View > Measurement Results from the menu. A Measurement Results subpanel is now visible at the bottom of the screen.
Step 25: Select Click Here to Evaluate a New Measurement. The Evaluate Measurement window opens.
Step 26: From the Functions or Macros list, select Max(1) to add a maximum function.
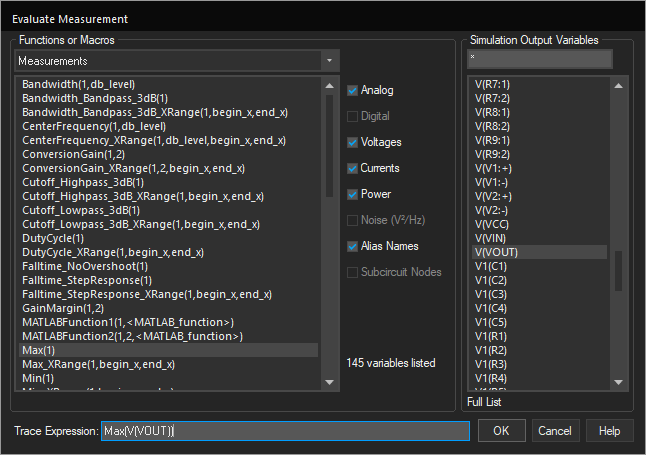
Step 27: From the Simulation Output Variables list, select V(VOUT) to add the V(VOUT) variable to the function.
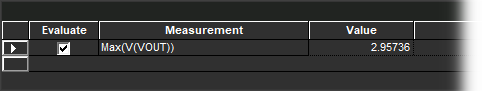
Step 28: Click OK. The measurement is added to the table and the Max(V(VOUT)) value is reported as 2.95736V.
Reusing a Plot Display
Step 29: Select Simulation > Edit Profile from the menu or the Edit Simulation Settings button from the toolbar.
Step 30: Select the Probe Window subpanel from the list on the left side of the window.
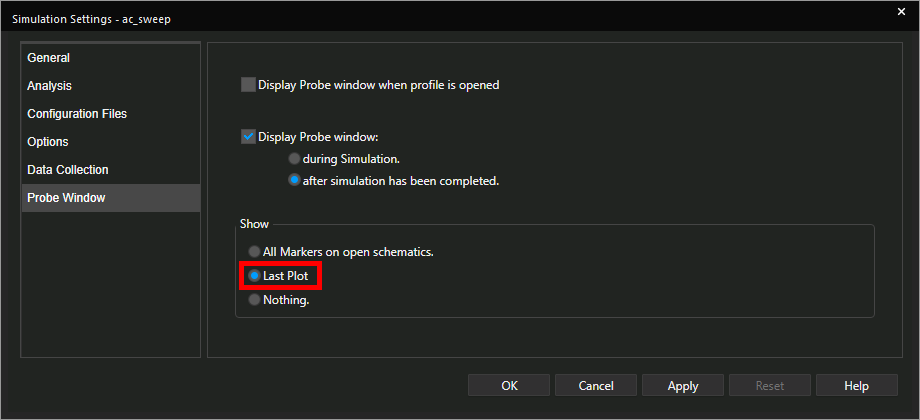
Step 31: Under Show, select Last Plot. Click OK to save the settings and close the window.
Note: This will configure the plot with the same settings, traces, plots, and measurements as the previous simulation. In this example, whenever the plot window is opened it will show the V(VOUT) and I(Q1:B) traces.
Step 32: Close the PSpice A/D window.
Step 33: Select PSpice > Run from the menu.
Step 34: View the results. The same plots are shown as before.
Wrap Up & Next Steps
Quickly and easily configure plot windows for optimal trace analysis in PSpice. Test out this feature and more with a free trial of OrCAD. Want to learn more about PSpice? Get access to free how-tos, courses, and walk-throughs at EMA Academy.

