When designing a circuit, verifying and optimizing performance is critical to PCB operation and reliability. Parametric sweeps and multi-dimensional parametric plots can help determine optimal component values with numerical analysis; however, fine-tuning the circuit may require a more visual approach. With PSpice Designer you can analyze circuit performance and plot a parametric sweep to quickly verify and optimize circuit functionality over a range of values with Performance Analysis.
This quick how-to will provide step-by-step instructions on how to analyze circuit performance with Performance Analysis in PSpice Designer.
To follow along, download the provided files above the table of contents.
How-To Video
 Open in New Window
Creating a Parameter List
Step 1: Open the provided design in PSpice Designer.
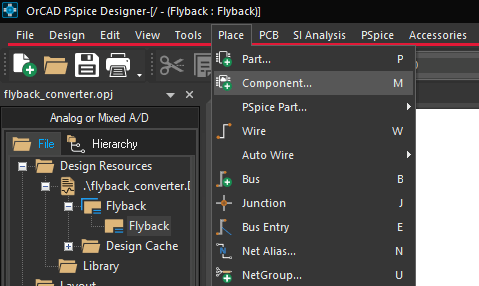
Step 2: To run performance analysis, a variable parameter must be defined. This can be done by placing a parameter list. Select Place > Component from the menu.
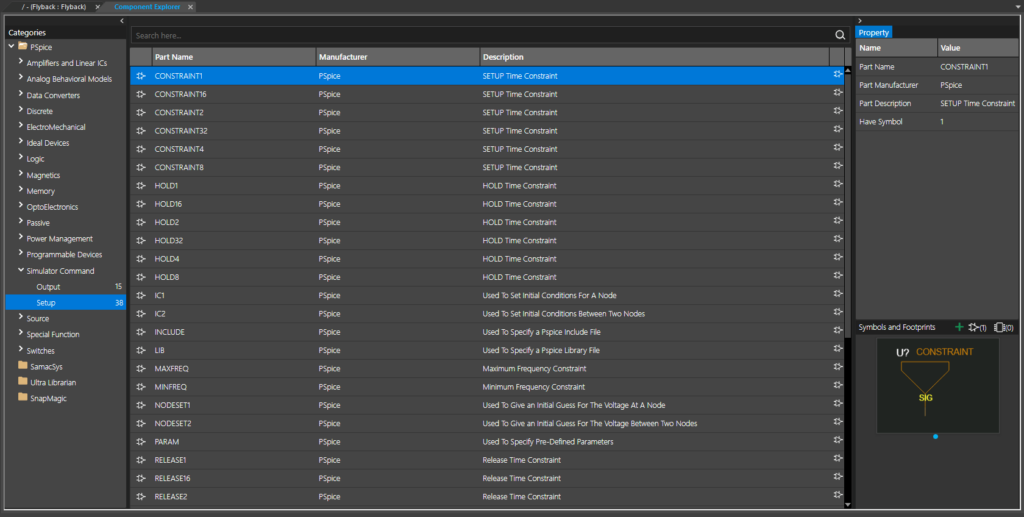
Step 3: The Component Explorer tab opens. From here, you can place components with pre-defined PSpice models as well as defined components from Ultra Librarian, SamacSys, and SnapMagic.
Expand PSpice and select Simulator Command > Setup.
Step 4: Select PARAM from the list. Double-click to attach the component to your cursor.
Note: This is a parameter list that can be used to define global parameters
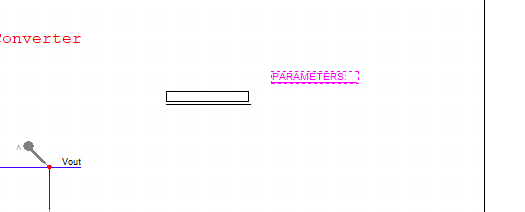
Step 5: Click to place the PARAM list in the schematic. Right-click and select End Mode.
Analyze Circuit Performance: Define Parameters
Step 6: Global parameters can be defined in the parameter list. To add parameters, double-click the list.
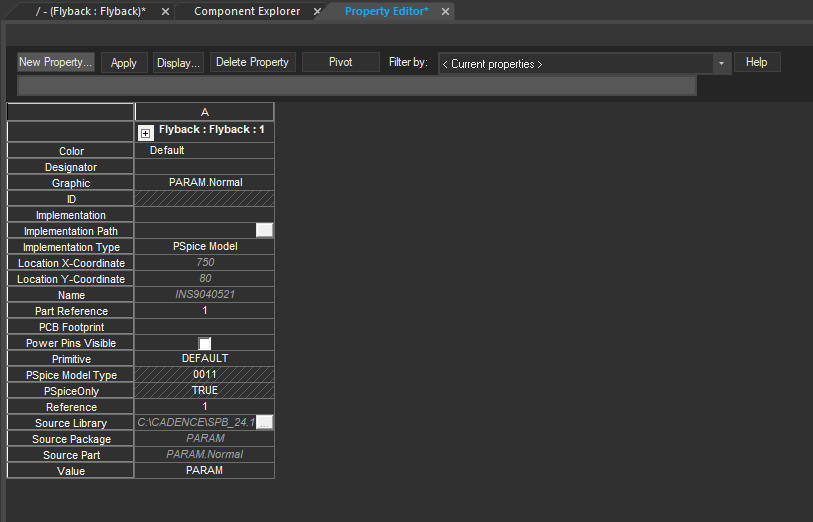
Step 7: The Property Editor tab opens. All properties for the selected object are defined in this window, as well as any global parameters for a PARAM list. Select New Property to add a new parameter.
Step 8: The Add New Property window opens. Enter RVAL for the property name and 15 for the value.
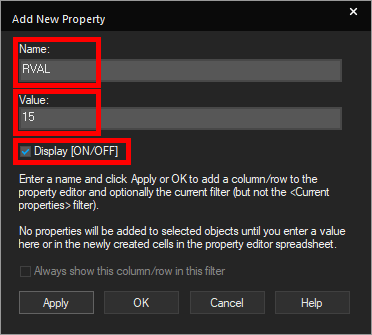
Step 9: Check Display [On/Off] to show the property on the parameter list object. Click OK.
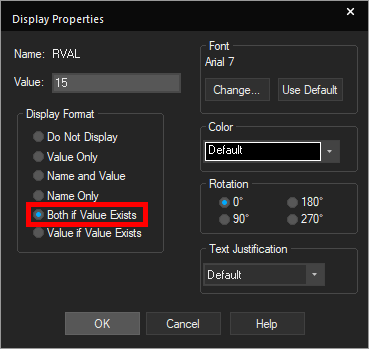
Step 10: The Display Properties window opens. Here you can define which components of the property are displayed. Select Both if Value Exists and click OK.
Step 11: Click Apply and close the Property Editor tab.
Step 12: For this example, the RVAL property will be assigned to the load resistor and swept. Double-click the value of the load resistor R_Load2 to change it.
Step 13: The Display Properties window opens. Enter {RVAL} for the value to assign the parameter as the resistance and click OK.
Analyze Circuit Performance: Define a Sweep
Step 14: Before performance analysis can be run, a transient simulation must be run and a parametric sweep must be defined. A transient simulation is already defined for this circuit. Select PSpice > Edit Simulation Profile from the menu.
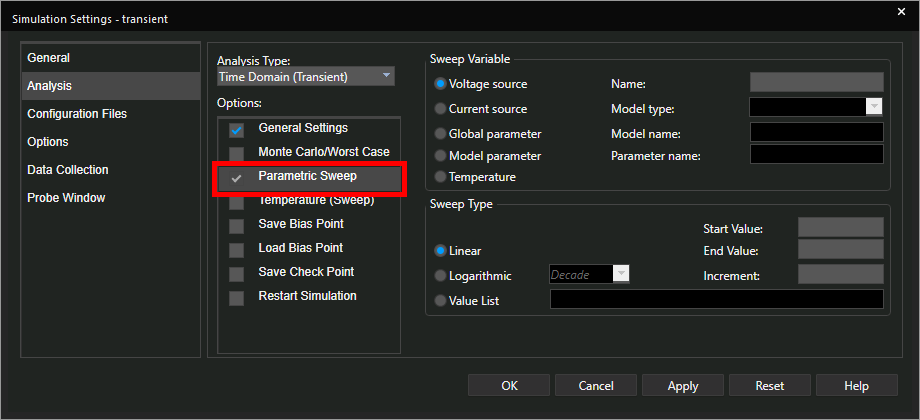
Step 15: The Simulation Settings window opens. Select and check Parametric Sweep under Options.
Step 16: Select Global Parameter for the Sweep Variable and enter RVAL for the Parameter Name.
Step 17: Select Linear for the Sweep Type.
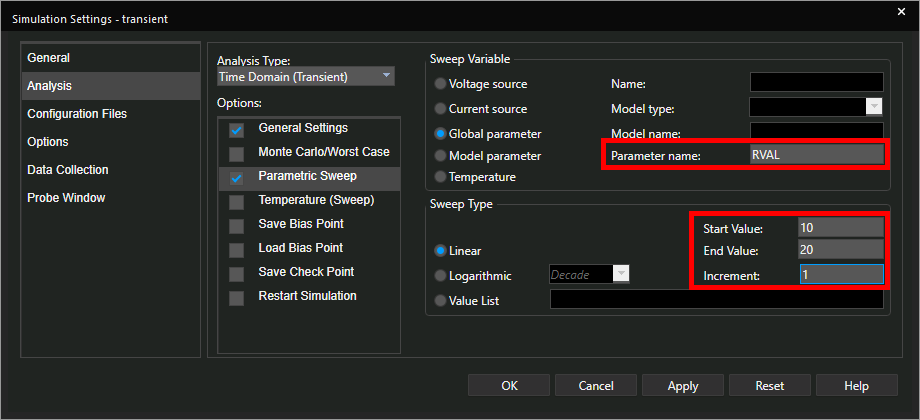
Step 18: Enter 10 for the Start Value, 20 for the End Value, and 1 for the Increment.
Note: This will repeat the simulation for values of RVAL ranging from 10-20, incrementing by 1.
Step 19: Click OK to save the simulation settings and close the window.
Running the Simulation
Step 20: With the sweep defined, the simulation is ready to be run. Select PSpice > Run from the menu.
Step 21: The Available Sections window with a list of runs for each value of RVAL opens. Select All to view all run results and click OK.
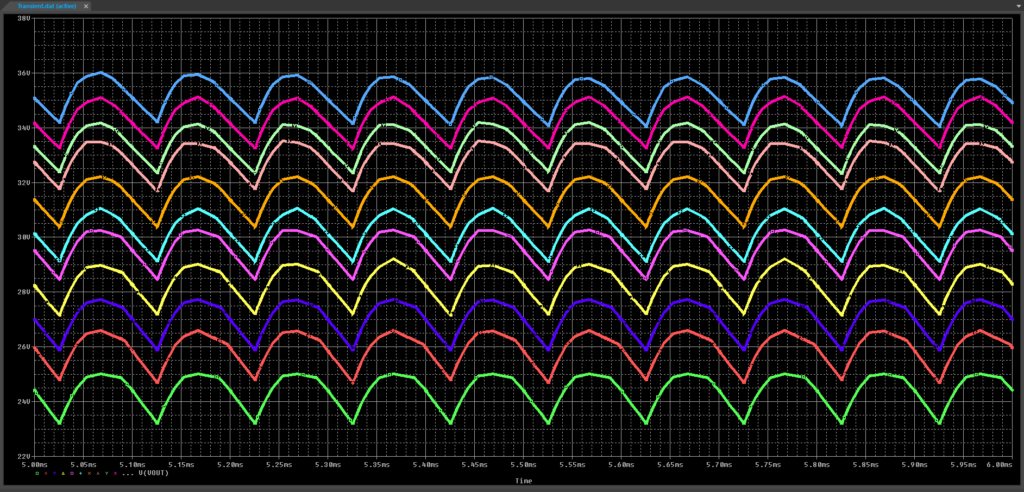
Step 22: View the simulation results. Each resistance value is shown in a different color. As resistance increases, peak output voltage increases as well. This can be plotted with Performance Analysis.
Activating Performance Analysis
Step 23: To start performance analysis, select Trace > Performance Analysis from the menu.
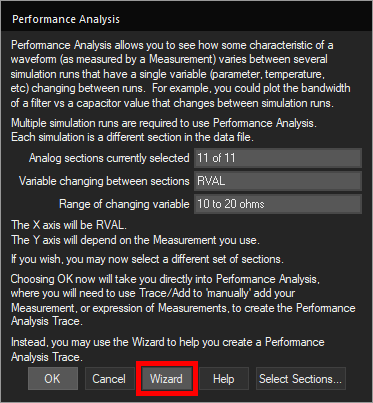
Step 24: The Performance Analysis window opens, showing the sections currently plotted. Select Wizard to define the Performance Analysis trace.
Step 25: The Performance Analysis Wizard opens to the intro section. Click Next.
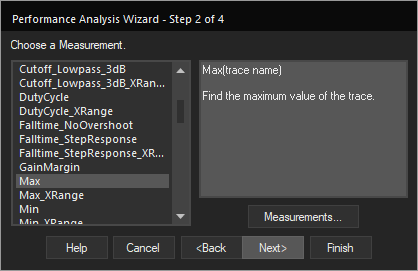
Step 26: First, a measurement must be defined. Select Max and click Next.
Note: The Max measurement calculates trace peak within the simulation.
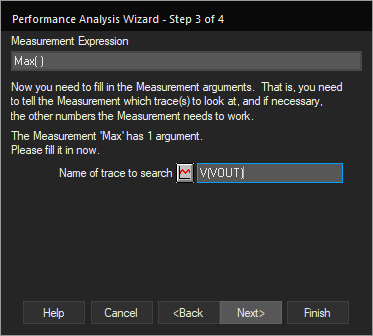
Step 27: Next, the trace to measure must be specified. Enter V(VOUT) into the Name of Trace to Search field. Click Next.
Step 28: A preview of the calculation is shown, with the peak voltage highlighted and labeled. Click Finish in the wizard.
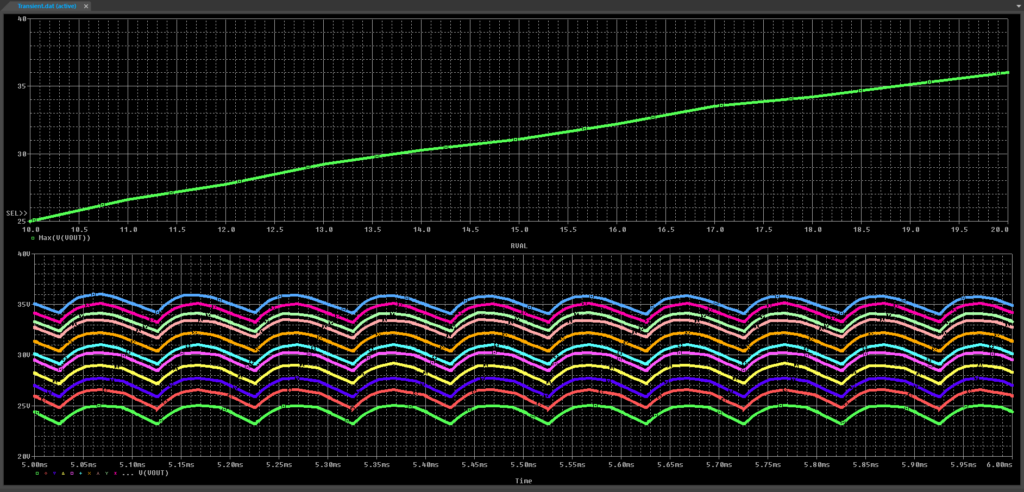
Step 29: View the plot window. A new trace is shown, with RVAL plotted in the X axis and Max(V(VOUT)) plotted in the Y axis. The trace shows a more or less linear relationship between load resistance and output voltage.
Wrap Up & Next Steps
Quickly and easily plot a parametric sweep to analyze circuit performance, verify circuit functionality, and optimize your PCB designs with Performance Analysis in PSpice Designer. Test out this feature and more with a free trial of OrCAD. Want to learn more about the advanced analysis options in PSpice? View the Level 1 and Level 2 PSpice Advanced Analysis workshops.

